


Observatorier omkring solsystemet slår sig sammen for at studere solens indflydelse
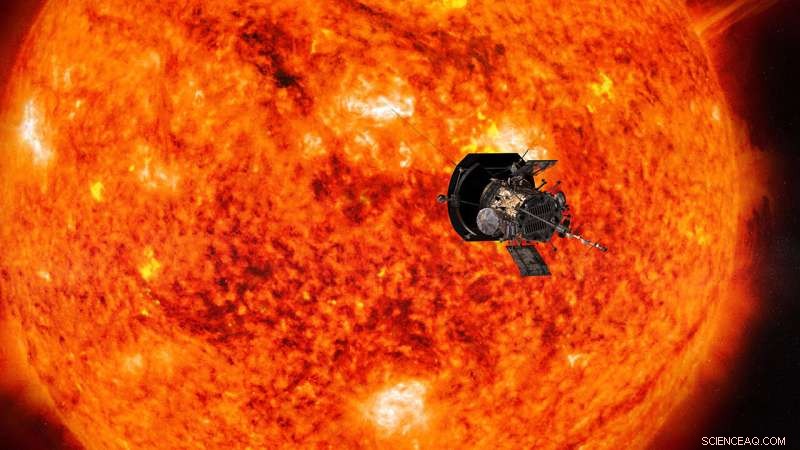
Illustration af Parker Solar Probe nærmer sig solen. Kredit: NASA/Johns Hopkins APL/Steve Gribben
Kernen i forståelsen af vores rummiljø er viden om, at forholdene i hele rummet – fra solen til planeternes atmosfærer til strålingsmiljøet i det dybe rum – er forbundet.
At studere denne forbindelse - et videnskabsområde kaldet heliofysik - er en kompleks opgave:Forskere sporer pludselige udbrud af materiale, stråling, og partikler på baggrund af den allestedsnærværende udstrømning af solmateriale.
Et sammenløb af begivenheder i begyndelsen af 2020 skabte et næsten ideelt rumbaseret laboratorium, kombinerer justeringen af nogle af menneskehedens bedste observatorier – inklusive Parker Solar Probe, i løbet af sin fjerde forbiflyvning af sol - med en stille periode i solens aktivitet, når det er nemmest at studere de baggrundsforhold. Disse forhold gav en enestående mulighed for forskere til at undersøge, hvordan solen påvirker forholdene på steder i rummet, med flere iagttagelsesvinkler og i forskellige afstande fra solen.
Solen er en aktiv stjerne, hvis magnetfelt er spredt over hele solsystemet, båret i solens konstante udstrømning af materiale kaldet solvinden. Det påvirker rumfartøjer og former miljøerne i verdener i hele solsystemet. Vi har observeret solen, rummet nær Jorden og andre planeter, og selv de fjerneste kanter af solens indflydelsessfære i årtier. Og 2018 markerede lanceringen af en ny, spilskiftende observatorium:Parker Solar Probe, med en plan om i sidste ende at flyve til omkring 3,83 millioner miles fra solens synlige overflade.
Parker har nu haft fire tætte møder af solen. (Dataene fra Parkers første møder med solen har allerede afsløret et nyt billede af dens atmosfære.) Under sit fjerde solmøde, spænder over dele af januar og februar 2020, rumfartøjet passerede direkte mellem solen og Jorden. Dette gav forskerne en unik mulighed:Solvinden, som Parker Solar Probe målte, når den var tættest på solen, ville dage senere, ankomme til jorden, hvor vinden selv og dens virkninger kunne måles af både rumfartøjer og jordbaserede observatorier. Desuden, solobservatorier på og nær Jorden ville have et klart overblik over de steder på solen, der producerede solvinden målt af Parker Solar Probe.
"Vi ved fra Parker-data, at der er visse strukturer, der stammer fra eller nær soloverfladen. Vi er nødt til at se på kilderegionerne for disse strukturer for fuldt ud at forstå, hvordan de dannes, udvikle sig, og bidrage til plasmadynamikken i solvinden, " sagde Nour Raouafi, projektforsker for Parker Solar Probe-missionen ved Johns Hopkins Applied Physics Laboratory i Laurel, Maryland. "Jordbaserede observatorier og andre rummissioner giver understøttende observationer, der kan hjælpe med at tegne det fulde billede af, hvad Parker observerer."
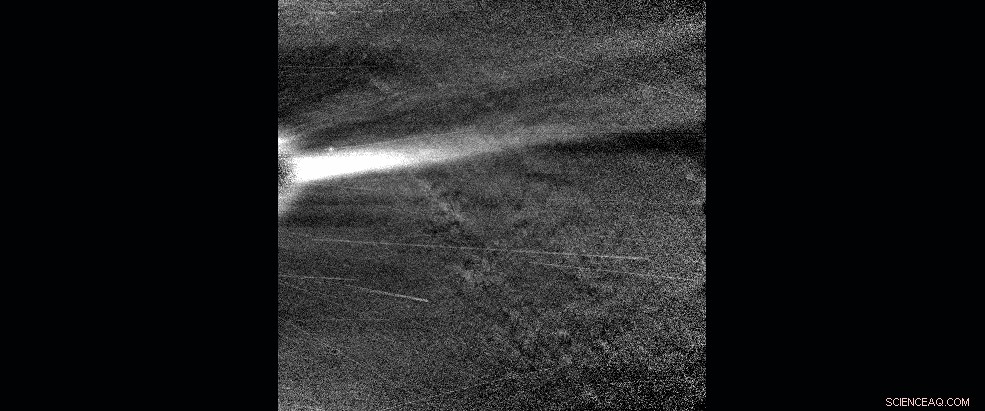
Denne animerede sekvens af billeder med synligt lys fra Parker Solar Probes WISPR-instrument viser en koronal streamer, observeret, da Parker Solar Probe var tæt på perihelium den 28. januar, 2020. Kredit:NASA/Johns Hopkins APL/Naval Research Lab/Parker Solar Probe
Denne himmelske justering ville være af interesse for videnskabsmænd under alle omstændigheder, men det faldt også sammen med en anden astronomisk periode af interesse for videnskabsmænd:solminimum. Dette er punktet under solens regelmæssige, cirka 11-årige aktivitetscyklusser, når solaktiviteten er på sit laveste niveau - så pludselige udbrud på solen, såsom soludbrud, koronale masseudstødninger og energiske partikelhændelser er mindre sandsynlige. Og det betyder, at det at studere solen nær solminimum er en velsignelse for forskere, der kan se et enklere system og dermed udrede, hvilke begivenheder der forårsager hvilke virkninger.
"Denne periode giver perfekte forhold til at spore solvinden fra solen til Jorden og planeterne, " sagde Giuliana de Toma, en solforsker ved High Altitude Observatory i Boulder, Colorado, der ledede koordineringen mellem observatorier for denne observationskampagne. "Det er en tid, hvor vi lettere kan følge solvinden, da vi ikke har forstyrrelser fra solen."
I årtier, videnskabsmænd har samlet observationer i disse perioder med solminimum, en indsats ledet af Sarah Gibson, en solforsker ved High Altitude Observatory, og andre videnskabsmænd. For hver af de seneste tre sol-minimumsperioder, videnskabsmænd samlede observationer fra en stadigt voksende liste over observatorier i rummet og på jorden, i håb om, at mængden af data om den uforstyrrede solvind ville afsløre ny information om, hvordan den dannes og udvikler sig. For denne minimumsperiode for solenergi, videnskabsmænd begyndte at indsamle koordinerede observationer fra begyndelsen af 2019 under paraplyen Whole Heliosphere and Planetary Interactions, eller WHPI for kort.
Denne særlige WHPI-kampagne omfattede et bredere end nogensinde før af observationer:dækkede ikke kun solen og virkningerne på Jorden, men også data indsamlet på Mars og rummets beskaffenhed i hele solsystemet – alt sammen i overensstemmelse med Parker Solar Probes fjerde og nærmeste forbiflyvning af solen.
WHPI-arrangørerne samlede observatører fra hele verden – og udenfor. Ved at kombinere data fra snesevis af observatorier på Jorden og i rummet giver forskere en chance for at male, hvad der måske er det mest omfattende billede nogensinde af solvinden:fra billeder af dens fødsel med solteleskoper, til prøver kort efter den forlader solen med Parker Solar Probe, til flerpunktsobservationer af dens skiftende tilstand i hele rummet.
Læs videre for at se eksempler på den slags data, der er fanget under dette internationale samarbejde mellem sol- og rumobservatorier.
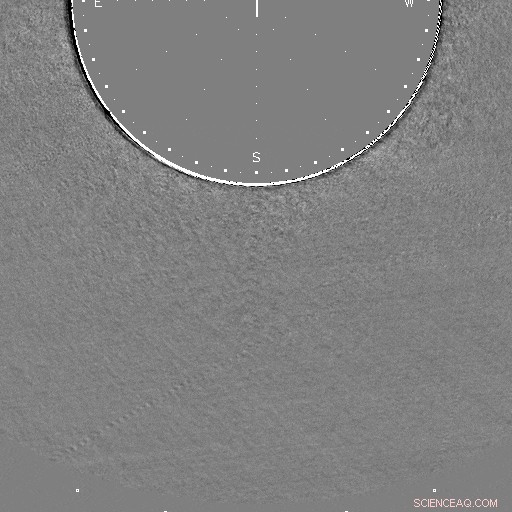
Data fra Mauna Loa Solar Observatory på Hawaii viser, at en stråle af materiale bliver kastet ud nær Solens sydpol den 21. januar, 2020 (UTC). Dette forskelsbillede skabes ved at trække pixels fra det forrige billede fra det aktuelle billede for at fremhæve ændringer. Kredit:Mauna Loa Solar Observatory/K-Cor
Parker solsonde
Tidlige data fra Parker Solar Probes tætte passage af solen under WHPI-kampagnen viser et solvindsystem, der er mere dynamisk end det, der er synligt i observationer nær Jorden. I særdeleshed, videnskabsmænd håber, at det fulde sæt af data - nedlinket til Jorden i maj 2020 - vil afsløre dynamiske strukturer, som små koronale masseudstødninger og magnetiske fluxreb i deres tidlige udviklingsstadier, som ikke kan ses med andre observatorier, der ser længere væk. Forbinder strukturer som denne, tidligere for lille eller for fjern til at se, med solvind og jordnære målinger kan hjælpe forskerne med bedre at forstå, hvordan solvinden ændrer sig gennem dens levetid, og hvordan dens oprindelse nær solen påvirker dens adfærd i hele solsystemet.
Mauna Loa solobservatorium
Parker Solar Probes nærbilleder af solvindstrukturer suppleres af solobservatorier på Jorden og i rummet, som har et større synsfelt til at fange solvindstrukturer.
Data fra Mauna Loa Solar Observatory på Hawaii viser, at en stråle af materiale bliver kastet ud nær solens sydpol den 21. januar, 2020. Coronale jetfly som dette er en solvindfunktion, som forskere håber at kunne observere nærmere med Parker Solar Probe, da de mekanismer, der skaber dem, kunne kaste mere lys over solvindens fødsel og acceleration.
"Det ville være ekstremt heldigt, hvis Parker Solar Probe observerede denne jet, da det ville give information om plasma og feltet i og omkring jetflyet ikke længe efter dets dannelse, " sagde Joan Burkepile, ledende videnskabsmand for Coronal Solar Magnetism Observatory K-coronagraph instrument ved Mauna Loa Solar Observatory, som fangede disse billeder.
Solar and Terrestrial Relations Observatory
Sammen med observationer af solvinden fra Parker Solar Probe og nær Jorden, scientists also have detailed images of the sun and its atmosphere from spacecraft like NASA's Solar Dynamics Observatory and the Solar and Terrestrial Relations Observatory. NASA's Solar and Terrestrial Relations Observatory, or STEREO, has a distinct view of the sun from its vantage point about 78 degrees away from Earth.
During this WHPI campaign, scientists took advantage of this unique viewing angle. From Jan. 21-23—when Parker Solar Probe and STEREO were aligned—the STEREO mission team increased the exposure length and frequency of images taken by its coronagraph, revealing fine structures in the solar wind as they speed out from the sun.
These difference images are created by subtracting the pixels of a previous image from the current image to highlight changes—here, revealing a small CME that would otherwise be difficult to see.
The Solar Dynamics Observatory, eller SDO, takes high-resolution views of the entire sun, revealing fine details on the solar surface and the lower solar atmosphere. These images were captured in a wavelength of extreme ultraviolet light at 171 Angstroms, highlighting the quiet parts of the sun's outer atmosphere, coronaen. This data—along with SDO's images in other wavelengths—maps much of the sun's activity, allowing scientists to connect solar wind measurements from Parker Solar Probe and other spacecraft with their possible origins on the sun.
Modeling the Data
Ideelt set scientists could use these images to readily pinpoint the region on the sun that produced a particular stream of solar wind measured by Parker Solar Probe—but identifying the source of any given solar wind stream observed by a spacecraft is not simple. Generelt, the magnetic field lines that guide the solar wind's movement flow out of the Northern half of the sun point in the opposite direction than they do in the Southern half. I begyndelsen af 2020, Parker Solar Probe's position was right at the boundary between the two—an area known as the heliospheric current sheet.
"For this perihelion, Parker Solar Probe was very close to the current sheet, so a little nudge one way or the other would make the magnetic footpoint shift to the south or north pole, " said Nick Arge, a solar scientist at NASA's Goddard Space Flight Center in Greenbelt, Maryland. "We were on the tipping point where sometimes it went north, sometimes south."
Predicting which side of the tipping point Parker Solar Probe was on was the responsibility of the modeling teams. Using what we know about the sun's magnetic field and the clues we can glean from distant images of the sun, they made day-by-day predictions of where, precisely, on the sun birthed the solar wind that Parker would fly through on a given day. Several modeling groups made daily attempts to answer just that question.
Using measurements of the magnetic field at the sun's surface, each group made a daily prediction for the source region producing the solar wind that Parker Solar Probe was flying through.
Arge worked with Shaela Jones, a solar scientist at NASA Goddard who did daily forecasting during the WHPI campaign, using a model originally developed by Arge and colleagues Yi-Ming Wang and Neil Sheeley, called the WSA model. According to their forecasts, the predicted source of the solar wind switched between hemispheres suddenly during the observation campaign, because Earth's orbit at the time was also closely aligned with the heliospheric current sheet—that region where the direction of magnetic polarity and the source of the solar wind switches between north and south. They predicted that Parker Solar Probe, flying in a similar plane as Earth, would experience similar switches in solar wind source and magnetic polarity as it flew near the sun.
Solar wind models rely on daily measurements of the sun's surface magnetic field—the black and white image underlaid. This particular model used measurements from the National Solar Observatory's Global Oscillation Network Group and a model that focuses on predicting how the sun's surface magnetic field will change over several days. Creating these magnetic surface maps is a complicated and imperfect process unto itself, and some of the modeling groups participating in the WHPI campaign also used magnetic measurements from multiple observatories. Det her, along with differences in each group's models, created a spread of predictions that sometimes placed the source of Parker Solar Probe's solar wind stream in two different hemispheres of the sun. But given the inherent uncertainty in modeling the solar wind's source, these different predictions can actually make for more robust operations.
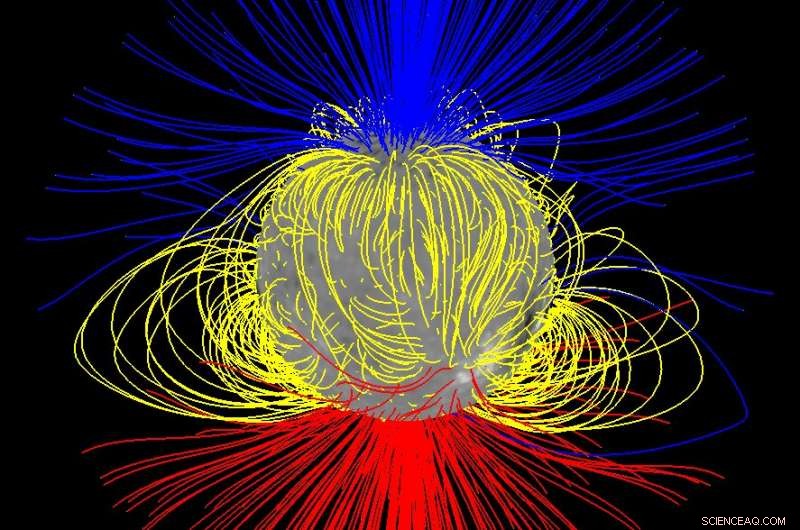
The sun's "open" magnetic field — shown in this model in blue and red, with looped or closed field shown in yellow — primarily comes from near the Sun's north and south poles during solar minimum, but it spreads out to fill space converging near the Sun's equator. Credit:NASA/Nick Arge
"If you can observe the sun in two different places with two telescopes, you have a better chance to get the right spot, " sagde Jones.
Poker Flat Incoherent Scatter Radar
The solar wind carries with it both an enormous amount of energy and the embedded magnetic field of the sun. When it reaches Earth, it can ring our planet's natural magnetic field like a bell, making it bend and deform—which produces a measurable change in magnetic field strength at certain points on Earth's surface. We track those changes because magnetic field oscillations can lead to a host of space weather effects that interfere with spacecraft or even, lejlighedsvis, utility grids on the ground.
A host of ground-based magnetometers have tracked these effects since the 1850s, and they're one of the many sets of data scientists are gathering in connection with this campaign. Other ground-based instruments can reveal the invisible effects of space weather in our atmosphere. One such system is the Poker Flat Incoherent Scatter Radar, or PFISR—a radar system based at the Poker Flat Research Range near Fairbanks, Alaska.
This radar is specially tuned to detect one of most reliable indicators of a disturbance in Earth's magnetic field:electrons in Earth's upper atmosphere. These electrons are created when particles trapped in the magnetosphere are sent zooming into Earth's atmosphere by a complex series of events, a set of circumstances known as a magnetospheric substorm.
On Jan. 16, PFISR measured the changing electrons in Earth's upper atmosphere during one such substorm. During a substorm, particles cascade into the upper atmosphere, not only creating the shower of electrons measured by the radar, but driving a more visible effect:the aurora. PFISR uses multiple beams of radar oriented in different directions, which allowed scientists to build up a three-dimensional picture of how electrons in the atmosphere changed throughout the substorm.
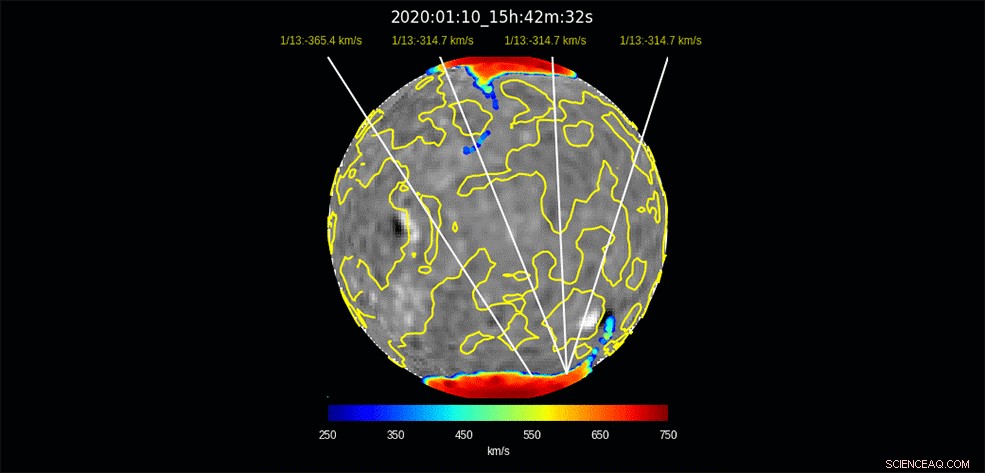
This model run — produced by Nick Arge and Shaela Jones using the WSA model — illustrates the predicted origin for solar wind that will impact Earth days later, spanning Jan. 10 – Feb. 3, 2020. The colored regions near the sun's north and south poles show the regions from which the solar wind flows out, with red regions showing a faster flow and blue regions showing a slower flow. The yellow lines on the sun divide areas of opposite magnetic polarity. The white lines indicate the predicted points of origin for the solar wind arriving at Earth at the given date. The black and white underlaid image shows a map of the magnetic field at the sun's surface, the basis for the model's predictions. The black regions are where the magnetic field points inward, toward the sun, and white regions are where the field points outward, away from the sun. Credit:NASA/Nick Arge/Shaela Jones
Because this substorm took place so early in the observation campaign—only one day after data collection began—it's unlikely that it was caused by conditions on the sun observed during the campaign. Men alligevel, the connection between magnetospheric substorms and the broader, global-scale effects created by the solar wind—called geomagnetic storms—isn't entirely understood.
"This substorm didn't happen during a geomagnetic storm time, " said Roger Varney, principal investigator for PFISR at SRI International in Menlo Park, Californien. "The solar wind during this event is fluctuating, but not particularly strongly—it's basically background noise. But solar wind is basically never steady; it's constantly putting some energy into the magnetosphere."
This deposit of energy into Earth's magnetic system has far-reaching effects:for one, changes in the composition and density of Earth's upper atmosphere can garble communications and navigation signals, an effect often characterized by total electron content. Changes in density can also affect the orbits of satellites to great degree, introducing uncertainty about precise position.
MAVEN
Earth isn't the only planet where the solar wind has measurable effects—and studying other worlds in our solar system can help scientists understand some of the solar wind's effects on Earth and how it influenced the evolution of Earth and other worlds throughout the solar system's history.
At Mars, the solar wind coupled with Mars' lack of a global magnetic field may be a major factor in the dry, barren world the Red Planet is today. Though Mars was once much like Earth—warm, with liquid water and a thick atmosphere—the planet has changed drastically over the course of its four-billion-year history, with most of its atmosphere being stripped away to space. With similar processes observed here on Earth, scientists leverage understanding of solar-planetary interactions at Mars to determine how processes leading to atmospheric escape has the ability to change whether a planet is habitable or not. I dag, the Mars Atmosphere and Volatile Evolution mission, or MAVEN, studies these processes at Mars. MAVEN observations at Mars are available for this latest WHPI campaign.
Over the coming months, heliophysicists around the world will begin to study data from these observatories in depth, hoping to draw connections that reveal new knowledge about the sun and its changes that influence Earth and space across the solar system.
Parker Solar Probe is part of the NASA Heliophysics Living with a Star program to explore aspects of the sun-Earth system that directly affect life and society. The Living with a Star program is managed by the agency's Goddard Space Flight Center in Greenbelt, Maryland, for NASA's Science Mission Directorate in Washington. The Johns Hopkins Applied Physics Laboratory in Laurel, Maryland, designet, built and operates the spacecraft and manages the mission for NASA.
 Varme artikler
-
 Mod det uendelige univers? Amerikanske lovgivere fremmer Space Corps planerDet er usandsynligt, imidlertid, at Space Corps vil blive til endnu, da senatets version af NDAA ikke har nogen sådan bestemmelse for det Amerikanske lovgivere fremlagde fredag et forsvarslov, d
 -
 Ploonets:Når måner bliver planeterExoplaneter - dem, der findes uden for solsystemet - kan smide deres måner, som derefter begynder at gå i kredsløb på egen hånd, faktisk bliver små planeter, deraf navnet ploonets. NASA/JPL-CALTECH H
 -
 Millioner strømmer ind i amerikanske byer på vej mod total formørkelseZoe Spyridonos afprøver eclipse-briller i Charleston, South Carolina forud for den totale solformørkelse den 21. august, 2017 På mandag, når en total solformørkelse fejer hen over USA for første g
 -
 Video:Sådan rydder du jordens kredsløb for rumaffaldUndersøgelsen fremhæver et grundlæggende skift i karakteren af skorpedannelse for 3,75 milliarder år siden, som lettede dannelsen af Jordens unikke, stabil kontinental skorpe. Kredit:CC0 Public Do
- Hvordan COVID-19 sætter kvinder i større risiko end mænd i Gauteng, Sydafrika
- Havvindmøllepark:Første af 11 vindmøller går op i Skotland-initiativet
- Juno stiller ind på radiostøj udløst af Jupiters vulkanmåne Io
- Egypten inviterer Musk, efter at aliens byggede pyramider tweet
- Klima i tempererede græslande
- Hvad er de atomer der udgør lipider?