Når flere COVID-19-data ikke er lig med større forståelse

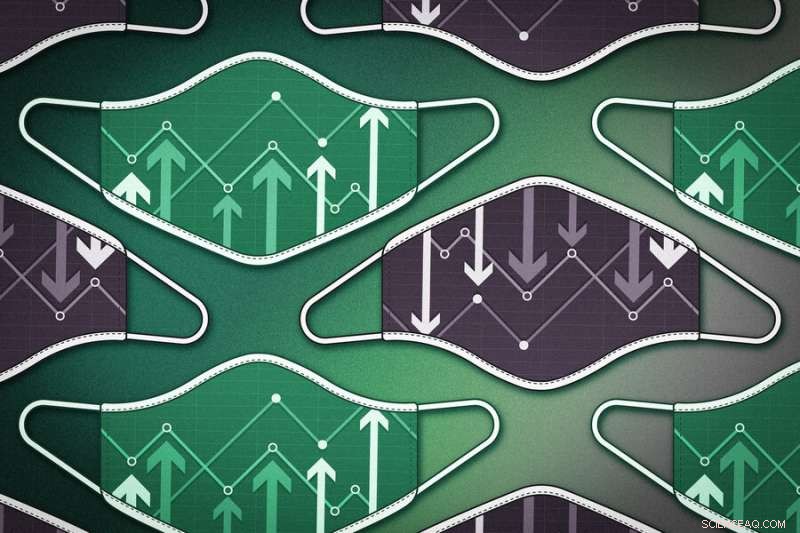
MIT-forskere fandt ud af, at Covid-19-skeptikere på Twitter og Facebook - langt fra at være "dataanalfabeter" - ofte bruger sofistikerede datavisualiseringsteknikker til at argumentere imod offentlige sundhedsmæssige forholdsregler som maskemandater. Kredit:Jose-Luis Olivares, MIT
Siden starten af COVID-19-pandemien, diagrammer og grafer har hjulpet med at kommunikere information om infektionsrater, dødsfald:Døde, og vaccinationer. I nogle tilfælde, sådanne visualiseringer kan tilskynde til adfærd, der reducerer virusoverførsel, som at bære en maske. Ja, pandemien er blevet hyldet som banebrydende øjeblik for datavisualisering.
Men nye resultater tyder på et mere komplekst billede. En undersøgelse fra MIT viser, hvordan coronavirus-skeptikere har samlet datavisualiseringer online for at argumentere mod folkesundheds-ortodoksi om fordelene ved maskemandater. Sådanne "modvisualiseringer" er ofte ret sofistikerede, ved hjælp af datasæt fra officielle kilder og state-of-the-art visualiseringsmetoder.
Forskerne gennemgik hundredtusindvis af opslag på sociale medier og fandt ud af, at coronavirus-skeptikere ofte anvender modvisualiseringer sammen med den samme "følg-data"-retorik som folkesundhedseksperter, alligevel argumenterer skeptikerne for radikalt anderledes politikker. Forskerne konkluderer, at datavisualiseringer ikke er tilstrækkelige til at formidle, hvor presserende COVID-19-pandemien er, fordi selv de klareste grafer kan fortolkes gennem en række forskellige trossystemer.
"Mange mennesker tænker på målinger som infektionsrater som objektive, " siger Crystal Lee. "Men det er de tydeligvis ikke, baseret på, hvor meget debat der er om, hvordan man tænker om pandemien. Det er derfor, vi siger, at datavisualiseringer er blevet en kampplads."
Forskningen vil blive præsenteret på ACM Conference on Human Factors in Computing Systems i maj. Lee er studiets hovedforfatter og ph.d. studerende i MITs historie, Antropologi, Videnskab, Teknologi, and Society (HASTS) program og MIT's Computer Science and Artificial Intelligence Laboratory (CSAIL), samt fellow ved Harvard Universitys Berkman Klein Center for Internet and Society. Medforfattere inkluderer Graham Jones, en Margaret MacVicar fakultetsstipendiat i antropologi; Arvind Satyanarayan, NBX Career Development Assistant Professor i Institut for Elektroteknik og Datalogi og CSAIL; Tanya Yang, en MIT bachelor; og Gabrielle Inchoco, en Wellesley College bachelor.
Da datavisualiseringer blev fremtrædende tidligt i pandemien, Lee og hendes kolleger satte sig for at forstå, hvordan de blev indsat i det sociale medieunivers. "En indledende hypotese var, at hvis vi havde flere datavisualiseringer, fra data indsamlet på en systematisk måde, så ville folk være bedre informeret, " siger Lee. For at teste den hypotese, hendes team blandede beregningsteknikker med innovative etnografiske metoder.
De brugte deres beregningsmetode på Twitter, skraber næsten en halv million tweets, der refererede til både "COVID-19" og "data". Med de tweets, forskerne genererede en netværksgraf for at finde ud af "hvem retweeter hvem, og hvem kan lide hvem, " siger Lee. "Vi skabte dybest set et netværk af fællesskaber, der interagerer med hinanden." Klynger inkluderede grupper som det "amerikanske mediefællesskab" eller "antimaskere." Forskerne fandt ud af, at antimaskegrupper skabte og delte datavisualiseringer lige så meget som , hvis ikke mere end, andre grupper.
Og de visualiseringer var ikke sjuskede. "De kan næsten ikke skelnes fra dem, der deles af almindelige kilder, " siger Satyanarayan. "De er ofte lige så polerede som grafer, du ville forvente at støde på i datajournalistik eller folkesundhedsdashboards."
"Det er et meget slående fund, " siger Lee. "Det viser, at karakterisering af antimaskegrupper som data-analfabeter eller ikke engagerer sig i dataene, er empirisk falsk."
Lee siger, at denne beregningsmæssige tilgang gav dem et bredt overblik over COVID-19-datavisualiseringer. "What is really exciting about this quantitative work is that we're doing this analysis at a huge scale. There's no way I could have read half a million tweets."
But the Twitter analysis had a shortcoming. "I think it misses a lot of the granularity of the conversations that people are having, " says Lee. "You can't necessarily follow a single thread of conversation as it unfolds." For that, the researchers turned to a more traditional anthropology research method—with an internet-age twist.
Lee's team followed and analyzed conversations about data visualizations in antimask Facebook groups—a practice they dubbed "deep lurking, " an online version of the ethnographic technique called "deep hanging out." Lee says "understanding a culture requires you to observe the day-to-day informal goings-on—not just the big formal events. Deep lurking is a way to transpose these traditional ethnography approaches to digital age."
The qualitative findings from deep lurking appeared consistent with the quantitative Twitter findings. Antimaskers on Facebook weren't eschewing data. Hellere, they discussed how different kinds of data were collected and why. "Their arguments are really quite nuanced, " says Lee. "It's often a question of metrics." For example, antimask groups might argue that visualizations of infection numbers could be misleading, in part because of the wide range of uncertainty in infection rates, compared to measurements like the number of deaths. Som svar, members of the group would often create their own counter-visualizations, even instructing each other in data visualization techniques.
"I've been to livestreams where people screen share and look at the data portal from the state of Georgia, " says Lee. "Then they'll talk about how to download the data and import it into Excel."
Jones says the antimask groups' "idea of science is not listening passively as experts at a place like MIT tell everyone else what to believe." He adds that this kind of behavior marks a new turn for an old cultural current. "Antimaskers' use of data literacy reflects deep-seated American values of self-reliance and anti-expertise that date back to the founding of the country, but their online activities push those values into new arenas of public life."
He adds that "making sense of these complex dynamics would have been impossible" without Lee's "visionary leadership in masterminding an interdisciplinary collaboration that spanned SHASS and CSAIL."
The mixed methods research "advances our understanding of data visualizations in shaping public perception of science and politics, " says Jevin West, a data scientist at the University of Washington, who was not involved with the research. Data visualizations "carry a veneer of objectivity and scientific precision. But as this paper shows, data visualizations can be used effectively on opposite sides of an issue, " he says. "It underscores the complexity of the problem—that it is not enough to 'just teach media literacy." It requires a more nuanced sociopolitical understanding of those creating and interpreting data graphics."
Combining computational and anthropological insights led the researchers to a more nuanced understanding of data literacy. Lee says their study reveals that, compared to public health orthodoxy, "antimaskers see the pandemic differently, using data that is quite similar. I still think data analysis is important. But it's certainly not the salve that I thought it was in terms of convincing people who believe that the scientific establishment is not trustworthy." Lee says their findings point to "a larger rift in how we think about science and expertise in the U.S." That same rift runs through issues like climate change and vaccination, where similar dynamics often play out in social media discussions.
To make these results accessible to the public, Lee and her collaborator, CSAIL Ph.D. student Jonathan Zong, led a team of seven MIT undergraduate researchers to develop an interactive narrative where readers can explore the visualizations and conversations for themselves.
Lee describes the team's research as a first step in making sense of the role of data and visualizations in these broader debates. "Data visualization is not objective. It's not absolute. It is in fact an incredibly social and political endeavor. We have to be attentive to how people interpret them outside of the scientific establishment."
Denne historie er genudgivet med tilladelse fra MIT News (web.mit.edu/newsoffice/), et populært websted, der dækker nyheder om MIT -forskning, innovation og undervisning.
 Varme artikler
-
 Efter at have knækket summen af terninger puslespil for 42, forskere opdager en ny løsning til 3I september 2019, forskere, at udnytte den kombinerede kraft fra en halv million hjemmecomputere rundt om i verden, for første gang fundet en løsning på 42. Det bredt rapporterede gennembrud ansporede
 -
 En elevs erfaring med matematik er påvirket af sammensætningen af den gruppe, de er iKredit:CC0 Public Domain Svage elever i højtydende matematiktimer, især drenge, føler mere skam sammenlignet med elever i dårligt præsterende matematiktimer. Stærkere studerende, på tur, kede dig
 -
 Er Dropa -stenene autentiske?Det er ikke en Dropa -sten, men snarere en jade bi -disk fra det sene Zhou -dynasti. Sådanne diske er relativt almindelige i kinesisk historie. © Heritage Images/Corbis Nix! Komme videre. Hvad kan
 -
 Håndvævede tekstiler – et skridt på vejen til bæredygtig mode?Suss Wilén og David Goldsmith Det hurtige industrielle modesystem, hvor overskuddet hovedsageligt går til dem i toppen, og som producerer store mængder bevidst affald, er en dinosaur, der ikke vil
- Hej Portal, Facebook vil måske reducere tabene nu på videoenheden
- Sådan beregnes reduktionsraten
- Afstembar belægning gør det muligt for hitch-hiking nanopartikler at glide forbi immunsystemet til…
- Månen har nøglen til at forbedre satellitbilleder af Jorden
- Studerende udvikler gratis robotprogrammeringssimulator
- Før du investerer i kryptovaluta, Læs dette


